Appendix 1 Detailed Methodology
Using satellite data to map light pollution
Suomi National Polar Orbiting Partnership (Suomi NPP)
The Suomi National Polar-orbiting Partnership or Suomi NPP is a weather satellite operated by the United States National Oceanic and Atmospheric Administration (NOAA). Launched in October 2011, the polar-orbiting satellite flies over any given point on Earth’s surface twice each day at roughly 1:30 a.m. and 1:30 p.m. (local solar time). Suomi NPP orbits 824 kilometres (512 miles) above the surface as it circles the planet 14 times a day. Data is sent once per orbit to a ground station in Svalbard, Norway, and continuously to local direct broadcast users around the world. The mission is managed by NASA with operational support from NOAA and its Joint Polar Satellite System, which manages the satellite’s ground system.
There are five instruments on the Suomi NPP satellite:
- The Advanced Technology Microwave Sounder (ATMS), a microwave radiometer, which models temperature and moisture for weather forecasting purposes.
- The Visible Infrared Imaging Radiometer Suite (VIIRS) captures visible and infrared imagery to monitor and measure processes including wildfires, ice motion, cloud cover, and land and sea surface temperature amongst other things.
- The Cross-track Infrared Sounder (CrIS), which measures temperature, atmospheric moisture and pressure for weather forecasting.
- The Ozone Mapping and Profiler Suite (OMPS) collects data that is used to track the health of the ozone layer.
- The Clouds and the Earth’s Radiant Energy System (CERES) monitors the amount of energy entering and exiting the atmosphere.
Of the above sensors, the important one for this study is the VIIRS instrument which is described in more detail in the next section. The VIIRS collects low light imaging data and has several improvements over the OLS’ capabilities.
Visible Infrared Imaging Radiometer Suite (VIIRS)
VIIRS is a scanning radiometer that collects visible and infrared imagery and radiometric measurements of the land, atmosphere, cryosphere (ice related), and oceans. VIIRS data is used to measure cloud and aerosol properties, ocean colour, sea and land surface temperature, ice motion and temperature, fires, and Earth’s albedo.1
The sensor collects data in a number of channels including:
- 5 High resolution imagery channels (I-bands)
- 16 Moderate resolution channels (M-bands)
- Day/Night Band (DNB)
It is the last of these that is of interest for this study – the Day/Night Band.
One of the major differences between the Suomi-NPP data and the DMSP-OLS derived data is the ground footprint. The Suomi-NPP VIIRS pixel footprint is 742m at nadir – the point on the surface of the earth directly below the satellite instrument.
VIIRS produces an image by repeatedly scanning a scene and resolving it as millions of pixels. The DNB sensor determines on-the-fly whether to use its low, medium or high gain mode to gather information on the amount of light emitted. If a pixel is very bright a low gain mode on the sensor prevents the pixel from over-saturating, by altering the exposure time. The opposite occurs if a pixel is dark.2
In 2012, NOAA published the first image of nighttime lights for the earth using the Suomi-NPP VIIRS DNB derived data. This first global product used data captured between 18-26 April 2012 and 11-23 October 2012 to generate a composite image using cloud free images.
What can be measured?
Whilst astronauts are able to take photos of the earth at night with a very high spatial resolution, a number of which have been widely publicised, they are limited to the orbit of the International Space Station which only passes over the same point every two or three days at variable times. Using the DNB data collected by the Suomi-NPP satellite, a daily picture is generated for every location at the same time every night (1:30am).
The VIIRS DNB sensor collects data in the spectral range of 500–900 nanometres (nm).
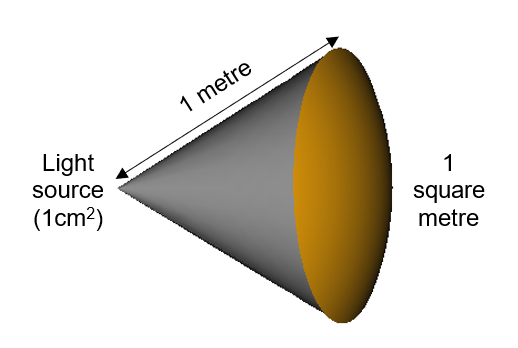
The radiance units are measured in nanowatts/cm2*sr where sr is steradians. A steradian is a section of a sphere where the surface area is equal to the radius of the full sphere. It represents the surface area required by a detector to detect the full radiant flux (energy) at any given distance.
For example, if 1cm2 on the ground was emitting 1 nanowatt of radiant flux and the recording device was 1 meter away, it would require a surface area of 1 square meter in order to collect all of the energy from that nanowatt.
As a further example, if 1cm2 on the ground was emitting 235 nanowatts of radiant flux and the recording device was 824km above the surface of the Earth (as the satellite is in this study), it would require a detector that is 824 km2 in order to fully absorb all 235 nanowatts. Since this satellite does not have detectors anywhere near that size, it instead measures the light that is detected by its detector and multiplies the size of that into the 824km2 to get the measurement of radiance.
The reason for this is that the intensity of light falls off with the inverse-square of distance – the intensity of the light is proportional to the square of the distance between the emitter and the detector. For example; a detector at 2km from the light source would detect a quarter of the light one at 1km would. Just detecting the light falling on the detector would take into account both the intensity of the light being detected, and its distance from the detector. Calculating the radiance removes the distance variable.
It is worth noting that whilst the data captured by the Suomi-NPP DNB offers significant improvements over that of the DMSP data, the Suomi-NPP DNB lacks sensitivity at wavelengths shorter than 500 nm. Because of this, the blue-light emission peak of white LEDs is not detected. This means that the “blue blindness” of the VIIRS DNB could falsely suggest a reduction in light pollution in some towns and cities in the future, whereas the brightness of the sky as seen by human eyes may in fact increase. This is a known limitation of this data.
It will also be important to monitor advances in technology that will enable this end of the spectral range to be explored in future.
Obtaining data to create a new national map
The algorithms and processes used to create the first 2012 image have been evolving and improving ever since. The Earth Observation Group (EOG) at Colorado School of Mines produces a Version 1 suite of monthly average radiance composite images using night time data from the Visible Infrared Imaging Radiometer Suite (VIIRS) Day/Night Band (DNB). Since January 2014, it has been possible to download monthly composites that have been filtered to exclude data impacted by stray light, lightning, lunar illumination and cloud cover.
These Version 1 composites span the globe and are produced in 15 arc second geographic grids as geotiff files. The globe is split into a set of 6 tiles (for storage, handling and processing purposes). Each tile includes two images:
- Average DNB radiance values, and
- Number of cloud free observations used to make the average.
The data are composited monthly, but there are areas of the globe where it is impossible to get good quality data coverages for some months of the year. Reasons for this include:
- Cloud cover (particularly in the tropics)
- Solar illuminations (particularly in areas near the poles in summer months).
There are two versions of each dataset which are created using different configurations. The first excludes any data impacted by stray light. The second includes these data if the radiance values have undergone the stray light correction procedure. The latter of these (stray light corrected) has more coverage towards the poles, and it is this set of data that has been selected for this study.
Data were downloaded from the website here:
https://eogdata.mines.edu/products/vnl/
Processing the data
Data covering Wales is available as part of a larger tile covering 120 degrees of latitude (75N/060W) and reaching south to the equator. Bringing the data into GIS, the raw data has a geographic projection of WGS841 and the coordinates are latitude and longitude.
Data has been clipped in GIS to the Wales boundary with an additional 5km buffer (so as to ensure the entire land area is covered by complete pixels).
The pixel size of the original dataset was 15 arc seconds and was projected in WGS84. This projection distorts the shape of land areas the further they are from the equator, so Great Britain becomes more distorted the further north the pixels are. The southernmost pixel was 300m by 460m, and the northernmost 225m by 469m.
In order to make the data display properly within the web map it was necessary to project it to WGS 1984 Web Mercator. This involved resampling the pixels from 15 arc seconds to 400m x 400m cells – a value chosen as it falls between the minimum and maximum pixels size within the original data.